Free Energy in Heterogeneous Catalysis
From EDFT to G(T, P, U)
@seokhyun choung|February 2026
Part 1Why Free Energy Mattersslides 3–5
Part 2ZPE, Vibrational Entropy, and Configurational Entropyslides 7–10
Part 3Gas Phase Thermodynamic Examples + Reference Stateslides 12–13
Part 4Phase Diagramsslides 15–17
Part 5Electrochemistry and CHEslides 19–20
Part 6How Wrong Can a Free Energy Calculation Be?slides 22–24
Part 7FAQslides 26–30
1
Why Free Energy Matters
The problem with the potential energy diagram
Atoms are constantly moving — yet DFT freezes everything at 0 K. Any accurate description of a "spontaneous" reaction, formation, or synthesis requires free energy, not internal energy.
1$E_{\text{DFT}}$static 0 K, no ZPE
2$E_0$$+ \text{ZPE} = \sum \tfrac{1}{2}h\nu_i$
3$G(T, P)$$+ H_{\text{thermal}} - TS$ (vibrational, configurational)
4$G_{\text{ec}}(U)$$- neU$ (CHE) + field effect, solvation
NH3 Synthesis — sign reversal (700 K)
ΔH0 = −0.95 eV
ΔG0 = +0.49 eV
CO on Pt — entropy dominates
ΔE = −1.5 eV
ΔG ~ −0.8 eV at 500 K
- Equilibrium coverage θi(T, P)
- TOF via energy span model
- Selectivity: products set by ΔG, not ΔE
- TST: $k = \frac{k_B T}{h} e^{-\Delta G_{\text{TS}}/k_B T}$
ΔG is the correct currency of chemistry. EDFT is only valid near 0 K in vacuum.
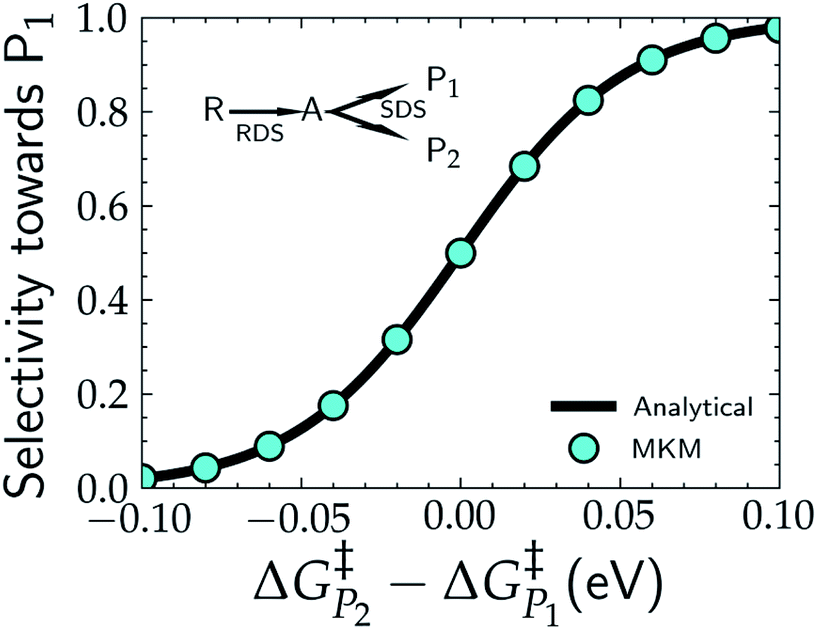
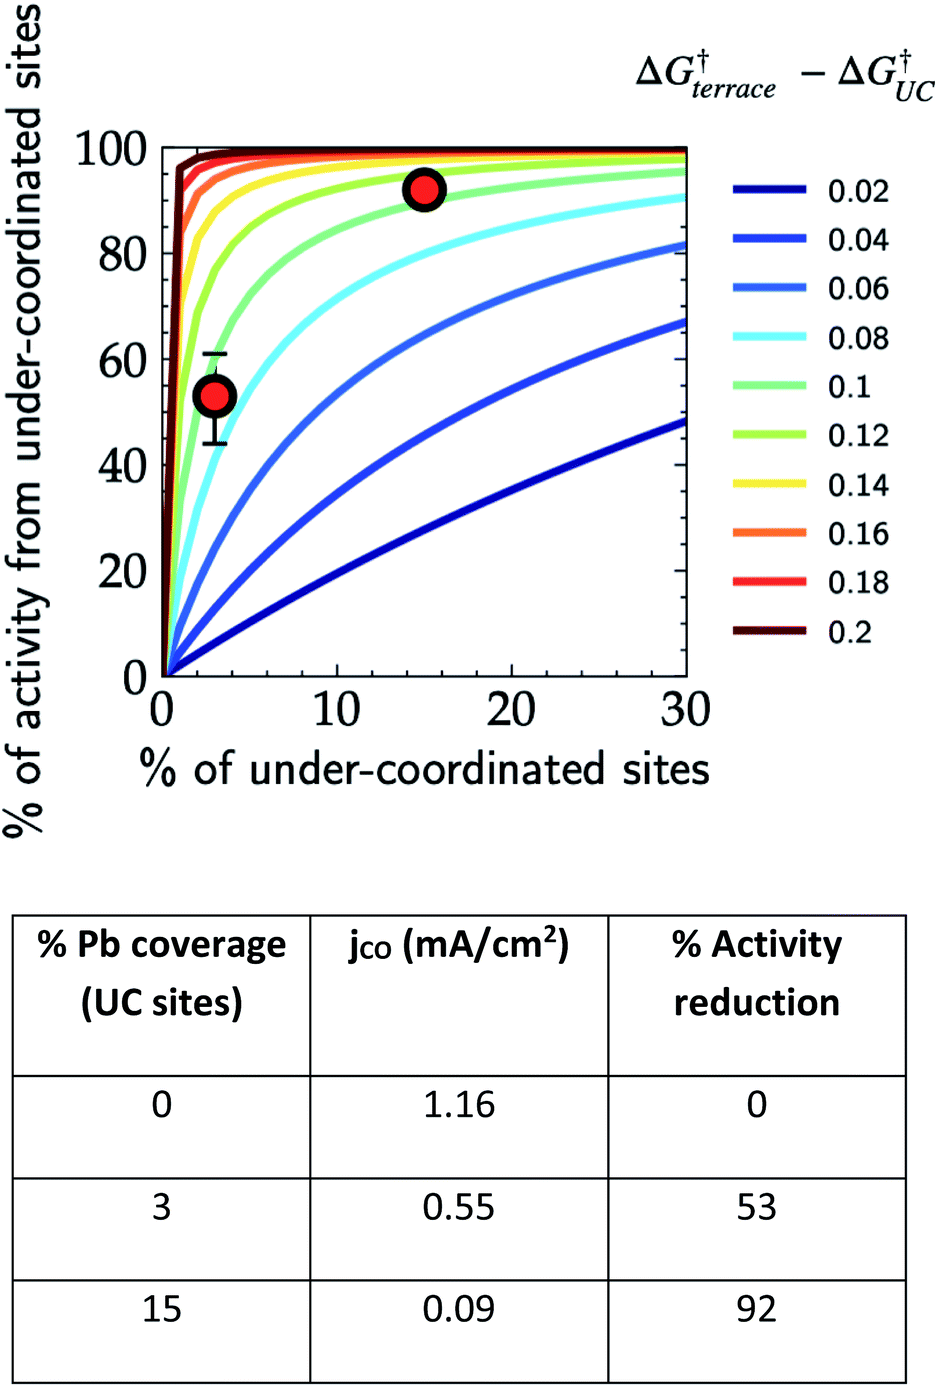
Selectivity switches sharply within $\pm 0.05$ eV of $\Delta G_{P_2}^{\ddagger} - \Delta G_{P_1}^{\ddagger}$
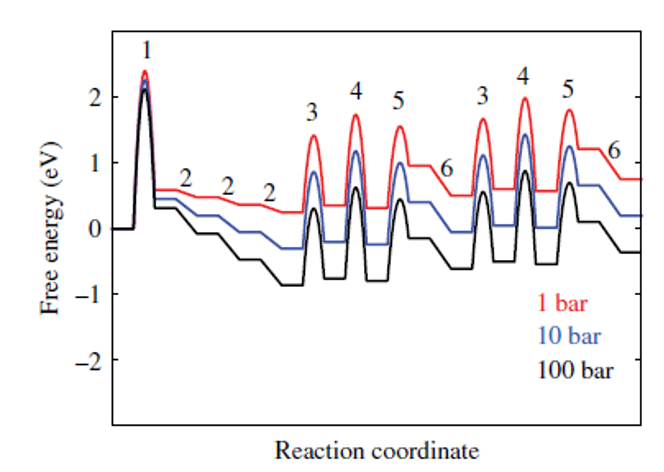
Contribution of under-coordinated sites to overall activity vs. their abundance and $\Delta G_{\text{terrace}}^{\dagger} - \Delta G_{\text{UC}}^{\dagger}$. Red markers: Pb-UPD on Au(111) for CO2RR at −0.6 V vs. RHE.
Small free energy differences (0.05–0.10 eV) — often smaller than DFT error bars — control which product forms and which site dominates. Getting $G$ right is not optional.
Figures: Govindarajan, Kastlunger, Heenen & Chan, Chem. Sci. 2022, 13, 14–26. DOI: 10.1039/D1SC04775B
2
ZPE and Entropy
The quantum ground state and the thermal ensemble
$E_{\min} = \tfrac{1}{2}h\nu$ above the potential well floor — Heisenberg uncertainty forbids a stationary particle
ZPE formula
- $\text{ZPE} = \sum \tfrac{1}{2}h\nu_i$ over all real vibrational modes
- N–H, O–H (above 3000 cm⁻¹): contribute 0.2–0.5 eV
- Low-frequency frustrated modes (below 200 cm⁻¹): negligible
- Only the change in ZPE between states matters (ΔZPE)
Quantitative warning
- NH3 synthesis: 0.83 eV too exothermic without ZPE (Norskov Table 2.1)
- H-transfer reactions: always include ZPE
- Safe to ignore: heavy adsorbates with no H transfer (ΔZPE below 0.05 eV)
Limitations: Classical high-$T$ limit assumed for rotational $q$ — breaks down for light molecules (H2) below ~80 K, safe above 300 K. For 2D translation, $S_{\text{site}}$ choice (unit cell vs. diffusion area) changes $q$ by 2–5×, ~0.03–0.07 eV in $TS$ at 500 K. If diffusion barrier exceeds ~$k_BT$, use hindered-translator correction (Campbell & Sellers, JACS 2012). All three replace HO only for low-frequency modes (<100 cm⁻¹), not stiff internal modes (>500 cm⁻¹).
Approach 1
Set $\Delta S_{\text{ads}} = 0$
Justified for surface-to-surface steps where entropy difference is below 0.05 eV. Fast and defensible for large-scale screening. (Norskov CHE 2004)
Approach 2
$S_{\text{ads}} = 0.70 \cdot S_{\text{gas}}$
Campbell and Sellers, JACS 2012. Factor 0.5–0.9 depending on binding strength. Appropriate for mobile physisorbed or weakly bound adsorbates.
Approach 3
Full harmonic partition function (ASE / VASPKIT)
T·S error typically 30–50% of surface mode contribution. Chemisorbed: T·S ~ 0.05–0.15 eV. Physisorbed: T·S ~ 0.3–0.5 eV with much larger error.
Approach 4
Ab initio MD (AIMD)
Sample the full potential energy surface at finite $T$ via Born-Oppenheimer or Car-Parrinello MD. Captures anharmonicity and diffusion naturally. Cost: ~100–1000× static DFT; limited to ps timescales and small cells.
Approach 5
MLIP-based MD
Machine-learned interatomic potentials (MACE, NequIP, CHGNet, etc.) trained on DFT data. Near-DFT accuracy at classical MD cost — enables ns timescales and large supercells for converged free energy sampling via thermodynamic integration or metadynamics.
$N$ adsorbates occupying $N_0$ surface sites ($\theta = N/N_0$) give rise to a configurational entropy that depends on coverage. * denotes a vacant site.
When it matters
- Microkinetic models solving $\theta$ self-consistently (e.g. CatMAP)
- Phase diagrams comparing surfaces at different coverages
- At $\theta = 0.5$: $T \cdot s_{\text{config}} \sim 0.018$ eV (300 K), 0.059 eV (1000 K)
When safe to ignore
- Comparing states at the same coverage — $S_{\text{config}}$ cancels
- Dilute limit ($\theta \to 0$) or saturated ($\theta \to 1$)
- Most CHE free energy diagrams omit this deliberately
3
Gas Phase Thermodynamic Examples
Where entropy and enthalpy compete
Equilibrium potentials at 298 K, pH 0 vs. SHE
CO2 → CO (2e⁻)
U = −0.10 VΔG = +0.20 eV/e⁻
TΔS ≈ 0 — same gas moles on both sides; entropy gives no relief
CO2 → CH4 (8e⁻)
U = +0.17 VΔG = −0.17 eV/e⁻, spontaneous
Large favorable ΔH overwhelms entropy penalty; thermodynamically easiest per electron
DFT without entropy will rank CO2RR product selectivity incorrectly at finite T and P
Absolute G from DFT is meaningless. Only differences matter. The reference molecule anchors the energy scale.
Two routes to T-dependent terms
- ASE IdealGasThermo — uses DFT vibrational frequencies
- NIST-JANAF tables — tabulated $[H(T) - H(298)]$ and $S(T)$ directly from experiment; no DFT frequencies needed. Covers most common gas molecules (H2, O2, H2O, CO2, NH3, CH4, etc.)
NIST-JANAF usage: $\mu(T) = E_{\text{DFT}} + \text{ZPE}_{\text{DFT}} + [H(T) - H(298)]_{\text{JANAF}} - T \cdot S(T)_{\text{JANAF}}$. Use JANAF for the thermal corrections only — $E_{\text{DFT}}$ and ZPE still come from your calculation. This avoids propagating DFT frequency errors into the gas-phase reference.
Worked example for H2O
At 298.15 K, 1 bar
Pressure term: $k_BT\ln(1/1) = 0$ eV
$\mu = E_{\text{DFT}} + \text{ZPE} + H_{\text{thermal}}(298) - 298 \cdot S(298)$
At 500 K, 0.01 bar
Pressure correction: $0.04313\ln(0.01) = -0.20$ eV
$\mu$ shifts by $-0.20$ eV relative to 1 bar
Pitfall: mixing NIST data with DFT total energies requires adding back $\Delta H_f^{\circ}$ (298 K) or using a fully consistent zero of energy. Never mix standards.
4
Phase Diagrams
Which state has the lowest G under reaction conditions?
A phase diagram maps which state has the lowest G as a function of T, P, pH, or U. Stability boundary: $\Delta G_{AB} = 0$
Construction
- Write $G(\text{variable})$ for each competing phase
- Lowest $G$ at each condition → stable phase
- Intersections define stability boundaries
- Variables: $T, P(\text{O}_2)$; $U, \text{pH}$; $\mu_C, \mu_N$
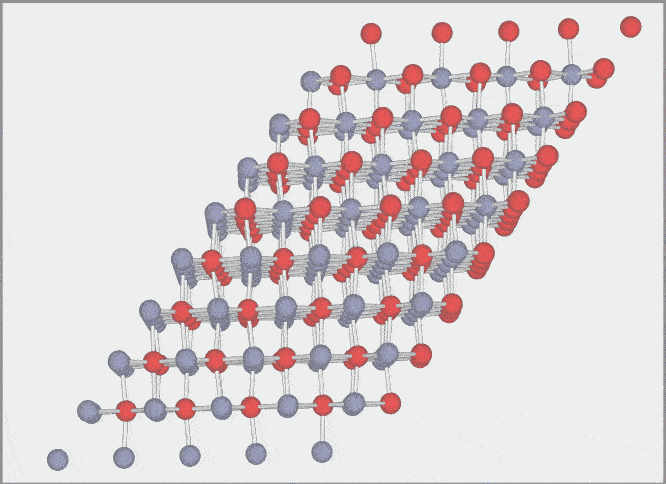
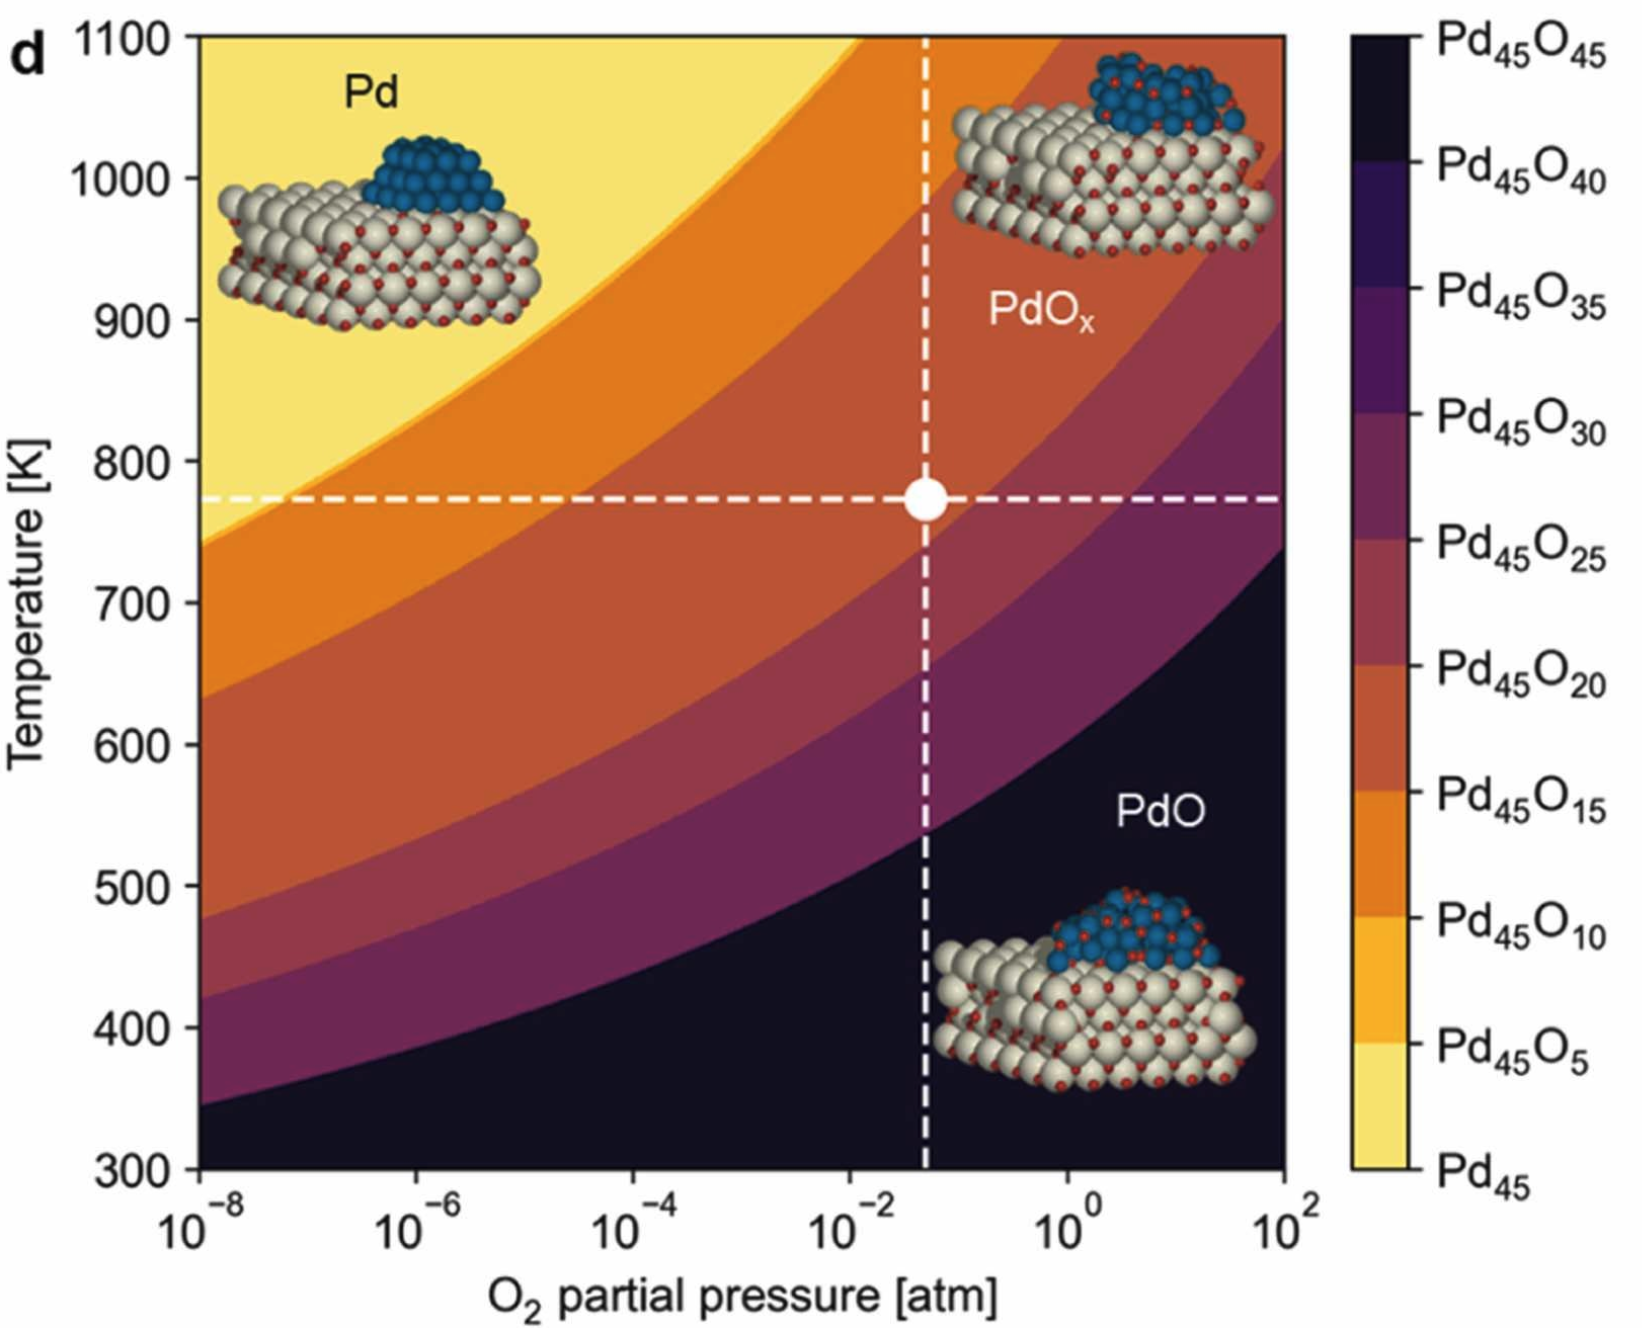
Example: PdOx/CeO2 CH4 Oxidation
Ryu, Choung et al. Appl. Catal. B 379 (2025) 125672
$\Delta G_{\text{ox}}(T, P_{\text{O}_2}) = \Delta G_f^{\circ}(\text{PdO}) + \tfrac{1}{2}RT\ln(P_{\text{O}_2}/P_{\text{ref}})$
- Defect-rich CeO2 stabilizes partially reduced PdOx via Ce3+ electron donation — shifts boundary to higher T
- Active state at phase boundary; dynamic redox pulse transiently crosses it
Construction
- Write $G(U, \text{pH})$ for each surface state. Slopes set by $n$ (electrons transferred).
- Lowest line at each $U$ is stable. Intersections → phase boundaries.
- Sweep pH 0–14 for 2D map. pH shifts by 0.0592 V/pH at 298 K.
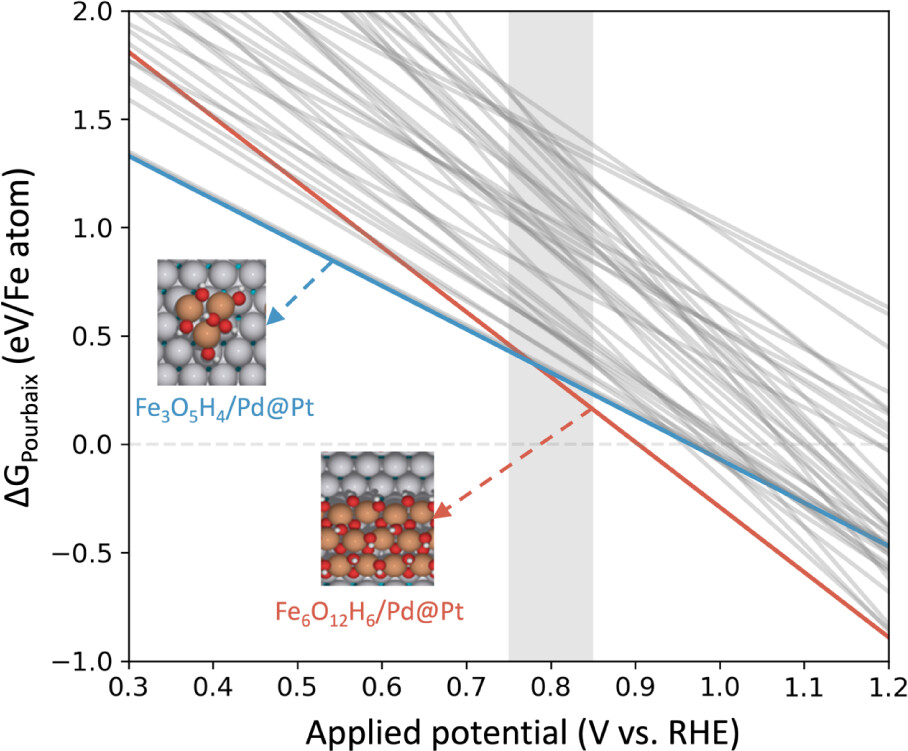
Example: Fe(OH)x/Pt ORR
Maiti, Choung et al. ACS Appl. Mater. Interfaces 17 (2025) 40517
- At ORR conditions (0.7–0.9 V vs. RHE): Fe3+(OH)3 or FeOOH is stable — not metallic Fe
- Pt substrate shifts boundaries vs. bulk Fe Pourbaix via charge transfer
- Engineer interface to pin Fe3+ oxidation state at operating potential
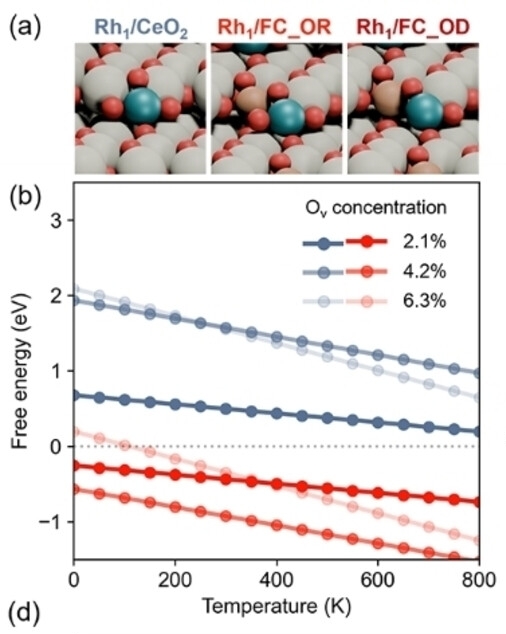
Kim, Choung et al. Angew. Chem. Int. Ed. 64 (2025) e202421218
Does Rh+ SAC remain stable vs. sintering to Rh⁰ under reaction conditions?
Competing states: Rh+/defect, Rh3+/stoichiometric, Rh⁰ cluster, dissolved Rhn+
- Ce3+ defects bind Rh+ ~0.5–1.0 eV more strongly than stoichiometric sites
- Defect-rich Fe-Ce oxide expands the Rh+ SAC stability window to lower P(O2) at high T
- Phase diagram directly predicts sintering resistance — confirmed by durability experiments
- Operating point inside SAC-stable region only for defect-rich support
5
Electrochemistry and CHE
The computational hydrogen electrode
Norskov et al. (2004): at U = 0 V vs. RHE, G(H⁺ + e⁻) = ½G(H2). Shifting U by −eU shifts every electron transfer step.
1Calculate ΔG for each step at U = 0 V vs. RHE using DFT + ZPE + entropy corrections
2Apply −eU per electron transferred. All e⁻ steps shift linearly with U.
3Equilibrium potential Ueq: where all ΔG are at most 0. Overpotential: η = Ueq − Uonset
CHE assumes no kinetic barriers — purely thermodynamic screening. Does not capture proton transfer barriers, solvent reorganization, or Frumkin corrections.
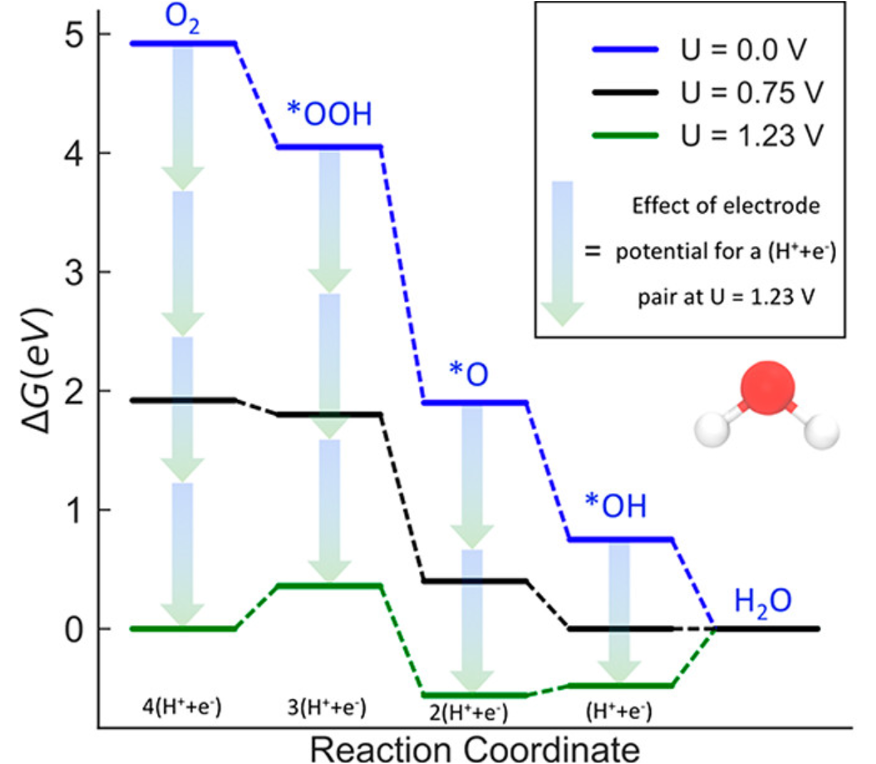
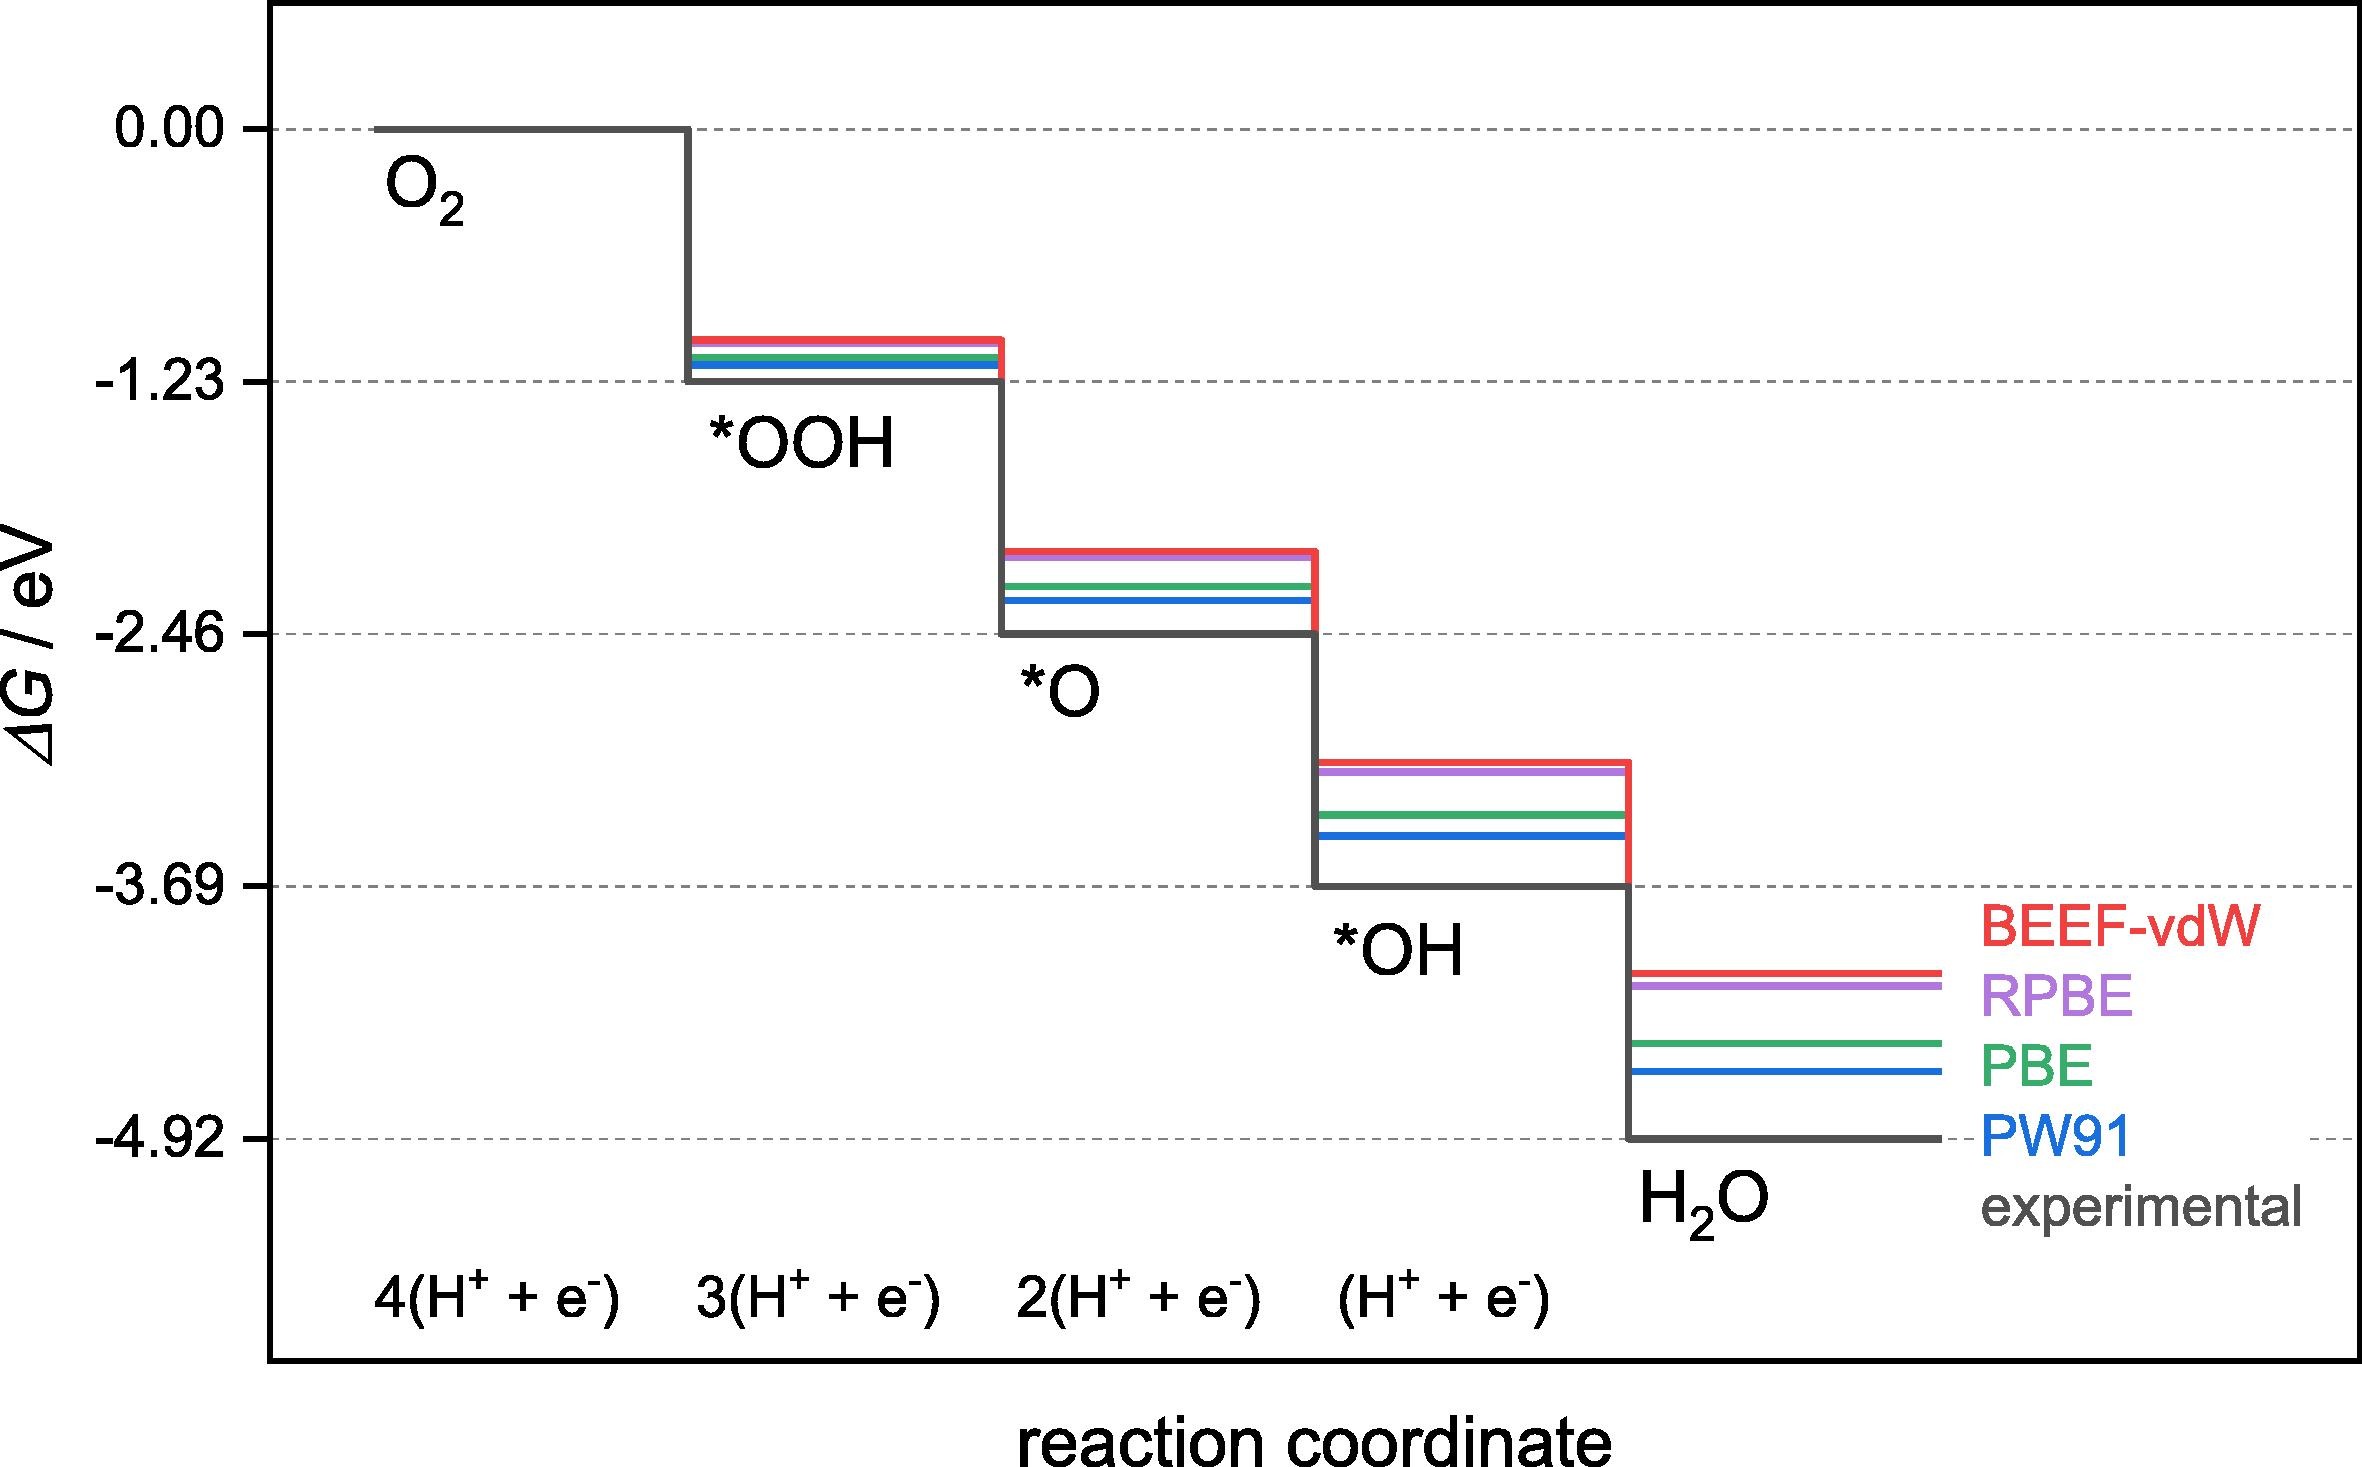
O2 + 4(H⁺ + e⁻) → 2H2O | 4-step associative mechanism on Pt(111)
1O2* → OOH*ΔG ~ +0.4 eV at U = 0 V — potential-determining step on Pt
2OOH* → O* + H2OΔG ~ −0.2 eV (downhill)
3O* → OH*ΔG ~ −0.5 eV at U = 0 V
4OH* → H2OΔG ~ −0.8 eV at U = 0 V; uphill at U = 0.80 V — explains ~0.35 V overpotential on Pt
Limiting potential UL is where the last uphill step reaches zero. Overpotential: η = Ueq − UL = 1.23 − UL
6
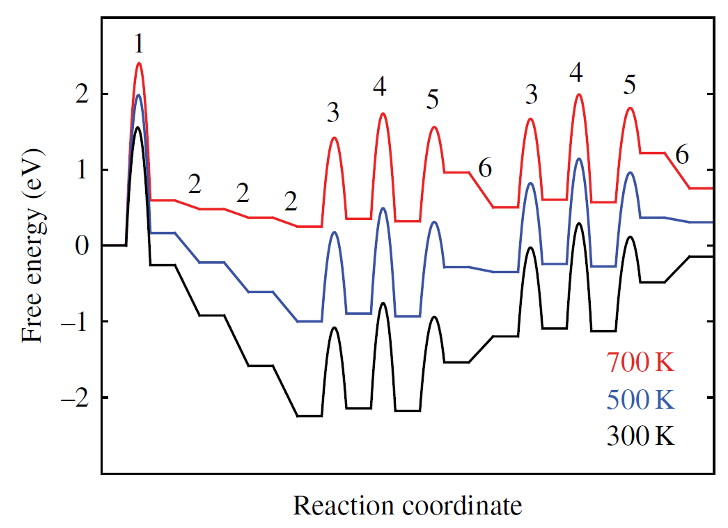
How Wrong Can a Free Energy Calculation Be?
Error tiers: functional, model, thermal, and site selection
Sargeant, Illas, Rodríguez & Calle-Vallejo, J. Electroanal. Chem. 896 (2021) 115178
GGA-PBE overbinds O-containing adsorbates
Systematic error of 0.2-0.4 eV for O*, OH*, OOH* on metals. Not random — correlated across similar adsorbates, so volcano plots still rank catalysts correctly. Absolute overpotentials can be wrong by 0.2-0.4 V.
When to worry
- Absolute adsorption energies vs. experiment
- Comparing different functional groups (O vs. N adsorbates)
- Oxides — GGA+U or HSE06 required
When errors cancel
- Relative energies within the same adsorbate family
- Volcano plot ordering (errors are correlated)
- Scaling relation slopes (largely functional-independent)
SlabThickness, k-points, vacuum: ~0.02-0.05 eV each — accumulates across a multi-step pathway
CoverageLateral interactions shift ΔG by 0.1–0.2 eV vs. dilute limit — adsorbate-adsorbate repulsion or attraction at high θ
SolvationIgnoring implicit solvation (VASPsol, SCCS) overestimates overpotential by 0.1-0.3 eV for electrochemical steps involving polar intermediates
ReferenceAbsolute G is meaningless — H2, H2O, CO2 pinning assumptions must be consistent and explicitly stated
Each tier is individually manageable. The danger is stacking all errors in the same direction across multiple steps. A 0.05 eV error per step becomes 0.20 eV over 4 steps.
Govindarajan, Kastlunger, Heenen & Chan, Chem. Sci. 2022, 13, 14–26
- DFT screening typically picks one binding site. If the chosen site is not the kinetically dominant one, the prediction fails regardless of numerical accuracy.
- Au(111) Pb-UPD contour analysis (Nitopi et al., Chem. Sci. 2022): 80-120 meV barrier difference between terrace and under-coordinated sites translates to 20x-100x higher TOF at UC sites via Arrhenius.
- Co oxide OER: minority defect sites show 100x higher TOF than average Co surface sites (Frei time-resolved FTIR; Plaisance microkinetic modeling). Dominant active site changes with applied potential.
- A 0.10 eV barrier difference is smaller than typical DFT error bars, yet it shifts which site controls the rate by 1-2 orders of magnitude. Site counting (Pb-UPD, redox peak integration, CO/CN probes) is essential.
- Even perfect DFT kinetics can be masked by mass transport limitations in experiment (low solubility of H2, O2, CO2).
7
FAQ
Common questions about free energy calculations
My advisor says "just use raw DFT energies." When is that defensible?
- Surface-to-surface steps with no H transfer and similar reactant/product masses — ΔG ~ ΔE within ~0.05 eV
- Screening large catalyst libraries (hundreds of materials) where trends matter more than absolute values
- Comparing within the same adsorbate family on similar metals — errors cancel in differences
- For gas-phase reactions at T above 400 K: entropy is never negligible — use NIST thermochemical tables
- For electrochemistry: CHE handles gas-phase T·S via H2 reference, but surface T·S still matters for rate-limiting steps
Always include ZPE if the reaction involves H transfer, compares very different adsorbates, or requires absolute overpotential accuracy below 0.20 V.
Approach 1 (ΔS = 0), Approach 2 (0.7 · Sgas), or full harmonic partition function?
Use 1
Surface-to-surface steps; fast screening
ΔS ~ 0 when both reactant and product are chemisorbed. T*ΔS below 0.05 eV. Default for large-scale DFT + CHE screening.
Use 2
Physisorbed or weakly bound intermediates
Mobile adsorbates (large molecules on surfaces, physisorption). Campbell factor 0.5-0.9 depending on binding energy. Quick estimate.
Use 3
Rate-limiting steps, validation, publication
Use ASE HarmonicThermo or VASPKIT 501. Report quasi-RRHO correction for modes below 100 cm⁻¹. Required for quantitative overpotential claims.
CHE is everywhere in the literature — what can it not do?
- No kinetic barriers — CHE is purely thermodynamic; actual barriers may differ by 0.3-0.8 eV
- No explicit solvent — implicit solvation can shift ΔG by 0.1-0.3 eV for polar intermediates
- No coverage dependence — lateral interactions shift onset potential by 0.1-0.2 V
- No Frumkin corrections — assumes ideal double-layer; fails at high overpotential
- Not for proton transfer steps involving Grotthuss hopping — need explicit water molecules
CHE is excellent for ranking and screening (approximately +/- 0.30 V accuracy). For quantitative experiment comparison, pair with microkinetic modeling and explicit solvation.
My ΔG values look unreasonably large or change when I change the supercell. What is wrong?
- Always reference all energies to the same chemical potentials: H → ½G(H2), O → G(H2O) − G(H2), C → G(CO2) − G(O2)
- Never mix DFT-computed gas-phase G with experimental enthalpies in the same pathway
- Supercell size affects absolute surface energy but not ΔG for chemisorption if the slab is converged
- For phase diagrams: set μO(T, P) = ½G(O2) + ΔμO(T, P) from NIST-JANAF or phonon calculation
Golden rule: ΔG for a balanced reaction must not depend on supercell size, k-point mesh, or ENCUT. If it does, you have a convergence or reference error.
Reviewers ask for error bars. What is a defensible uncertainty estimate?
- DFT functional: +/- 0.2-0.4 eV for O* family on metals (PBE); cite a systematic benchmark for your specific system
- Thermal corrections: +/- 0.05 eV for chemisorbed at 300 K; +/- 0.15 eV for physisorbed or T above 700 K
- Model setup: converge slab thickness, k-mesh, ENCUT systematically and report convergence criteria explicitly
- Propagate errors: use linear error propagation for multi-step pathways; $\sigma_{\text{total}} = \sqrt{\sum \sigma_i^2}$
Minimum to report: functional, basis set, k-point mesh, slab geometry, which thermal corrections were applied, and what was set to zero with justification.
EDFT is a photograph. G(T,P) is a film.
Free energy tells the full story of what actually happens
Every correction matters
Know what you are ignoring, and why
The phase diagram does not lie
Compute boldly. Correct carefully. Interpret honestly.